
Logstash and ELK
lagstash笔记(1)
download
https://www.elastic.co/downloads/logstash
documents
https://www.elastic.co/guide/en/logstash/current/index.html
first tasted
bin/logstash -e 'input { stdin { } } output { stdout {} }'
Settings: Default pipeline workers: 4
Logstash startup completed
I'm two8g
2016-03-26T02:52:03.667Z two8gPC I'm two8g
Hello logstash
2016-03-26T02:52:21.417Z two8gPC Hello logstash
Logstash adds timestamp and IP address information to the message. Exit Logstash by issuing a CTRL-D
Setting Up an Advanced Logstash Pipeline
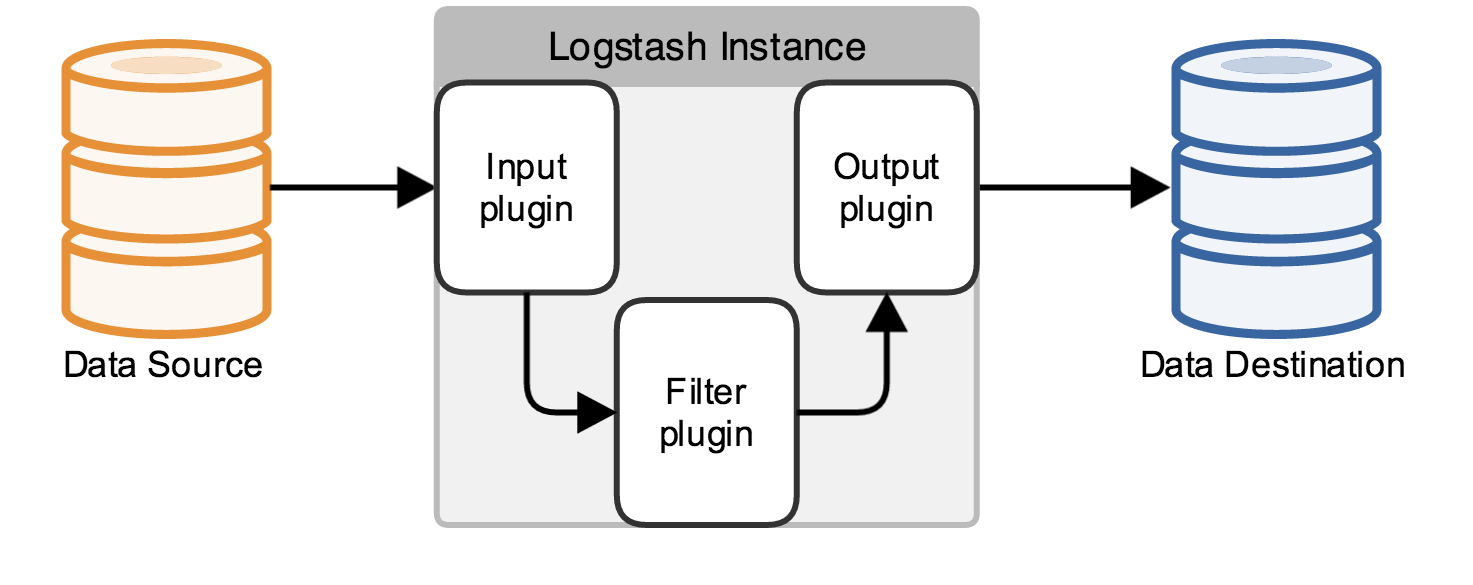
Logstash 管道流包含一个或多个input,filter,output插件集合 Logstash 配置文件定义管道流。当启动一个Logstash实例时,使用 -f <path/to/file> 指定配置文件来设置管道流。
一个Logstash管道流有两个必选响input,output,一个可选项filter. input plugins: consume data from a source filter plugins: modify the data as you specify the output: plugins write the data to a destination
Parsing Apache Logs into Elasticsearch
Configuring Logstash for File Input
first-pipeline.conf
input {
     file {
         path => "/path/to/logstash-tutorial.log"
         start_position => beginning ①
         ignore_older => 0 ②
     }
 }
① 设置数据读取的起始位置,默认监控新数据行,like tail -f.
② 默认忽略最后修改时间超过86400s,或许我们不想忽略如何文件
Parsing Web Logs with the Grok Filter Plugin
grok 是 Logstash 默认支持的filter插件之一。相关插件文档:
https://www.elastic.co/guide/en/logstash/current/working-with-plugins.html
grok 查找日志中的 patterns , 需要你配置你想要搜集的 patterns。
日志
83.149.9.216 - - [04/Jan/2015:05:13:42 +0000] "GET /presentations/logstash-monitorama-2013/images/kibana-search.png
 HTTP/1.1" 200 203023 "http://semicomplete.com/presentations/logstash-monitorama-2013/" "Mozilla/5.0 (Macintosh; Intel
 Mac OS X 10_9_1) AppleWebKit/537.36 (KHTML, like Gecko) Chrome/32.0.1700.77 Safari/537.36"
| Information | Field Name |
|---|---|
| IP Address | clientip |
| User ID | ident |
| User Authentication | auth |
| timestamp | timestamp |
| HTTP Verb | verb |
| Request body | request |
| HTTP Version | httpversion |
| HTTP Status Code | response |
| Bytes served | bytes |
| Referrer URL | referrer |
| User agent | agent |
配置filter
filter {
     grok {
         match => { "message" => "%{COMBINEDAPACHELOG}"}
     }
 }
过滤后结果
{
 "clientip" : "83.149.9.216",
 "ident" : ,
 "auth" : ,
 "timestamp" : "04/Jan/2015:05:13:42 +0000",
 "verb" : "GET",
 "request" : "/presentations/logstash-monitorama-2013/images/kibana-search.png",
 "httpversion" : "HTTP/1.1",
 "response" : "200",
 "bytes" : "203023",
 "referrer" : "http://semicomplete.com/presentations/logstash-monitorama-2013/",
 "agent" : "Mozilla/5.0 (Macintosh; Intel Mac OS X 10_9_1) AppleWebKit/537.36 (KHTML, like Gecko) Chrome/32.0.1700.77 Safari/537.36"
 }